
How do we debug typescript?
Before we get started with anything else, can we debug in typescript itself? Not the generated javascript files, but the source typescript? The answer is yes.
You need to tell the typescript compiler to keep the source map files. By passing the --sourceMap option when
initializing the project or by adding the "sourceMap": true configuration to the tsconfig.json file.
With a modern chrome browser you can then easily debug your code in typescript it self. The source .ts files are
loaded into the debugger.
For example once I run a small Angular 2 app written in typescript, all I have to do is simply start the developer console. The source files will be automatically loaded.
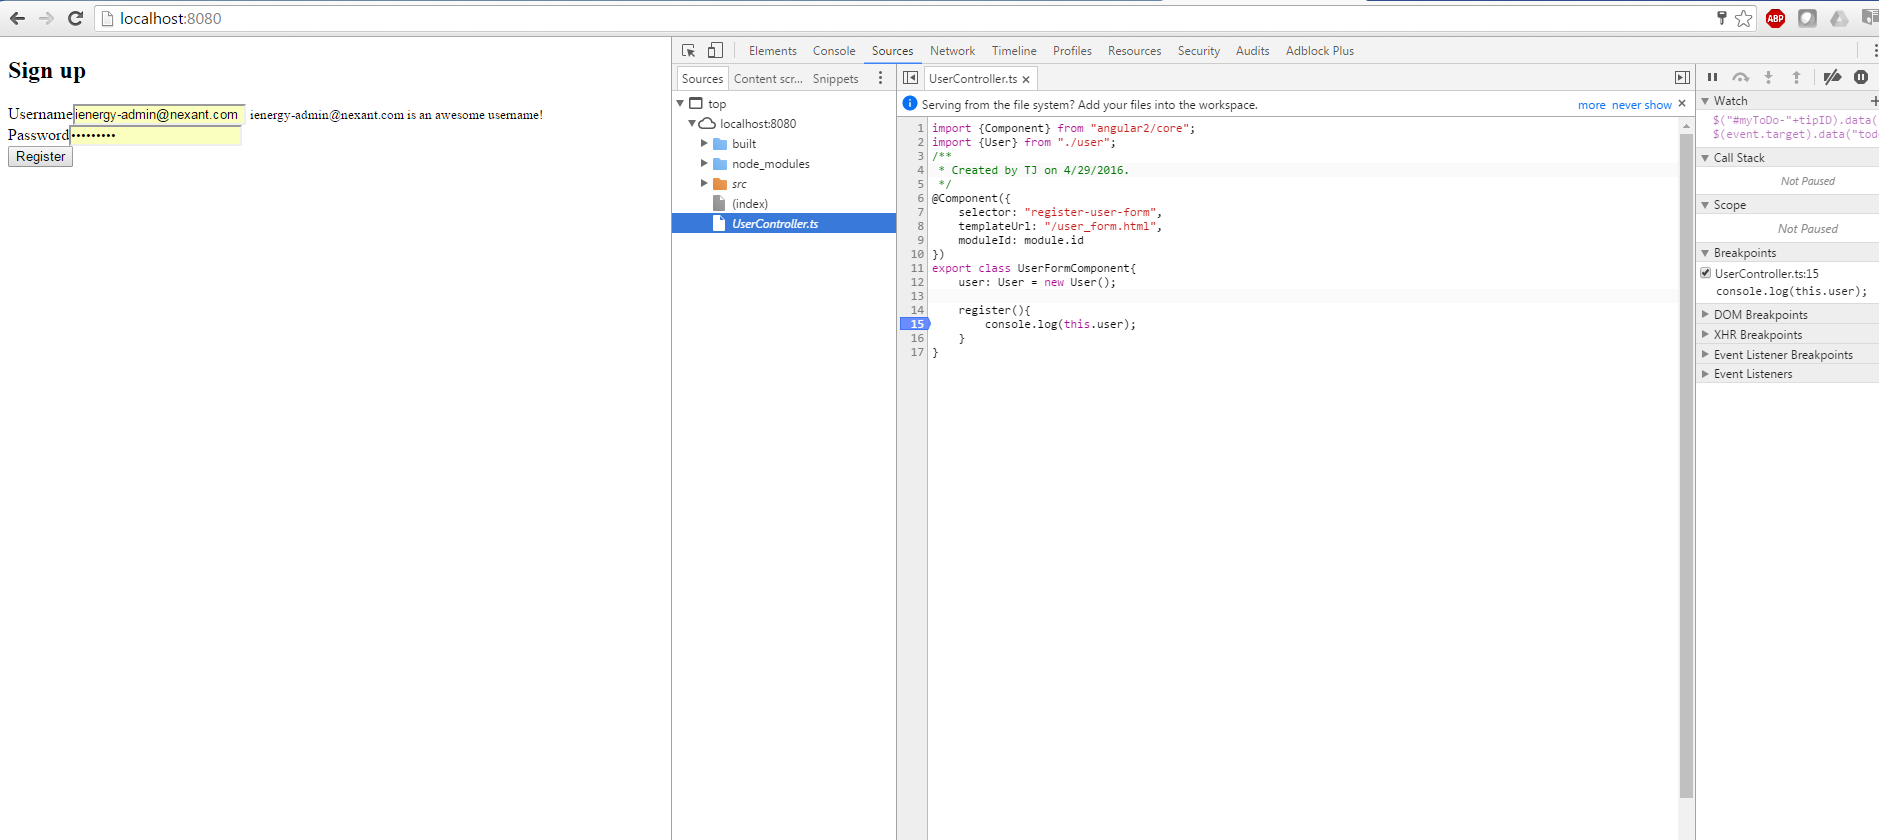
Now you can simply start debugging the typescript files as you would javascript.
If you take a look at the generated source mapping files, you will see that it stores the location of the source file.
"file":"UserController.js","sourceRoot":"","sources":["../UserController.ts"]
Thus allowing a compatible browser like chrome to load the typescript files to debug.
If your source files are not loaded it’s possible the option isn’t enabled via the browser console settings. In chrome the developer tool settings contain the option to disable or enable javascript source maps.